Inspect the Live Element Tree
kiln embeds Clay's own debug panel. Not a reimplementation and not a screenshot tool: Clay_SetDebugModeEnabled turns on the inspector that ships inside clay.h, walking the same tree the solver just used to lay out the screen you are looking at. It is the same panel you can try on nicbarker.com/clay, pointed at a desktop instead of a website.
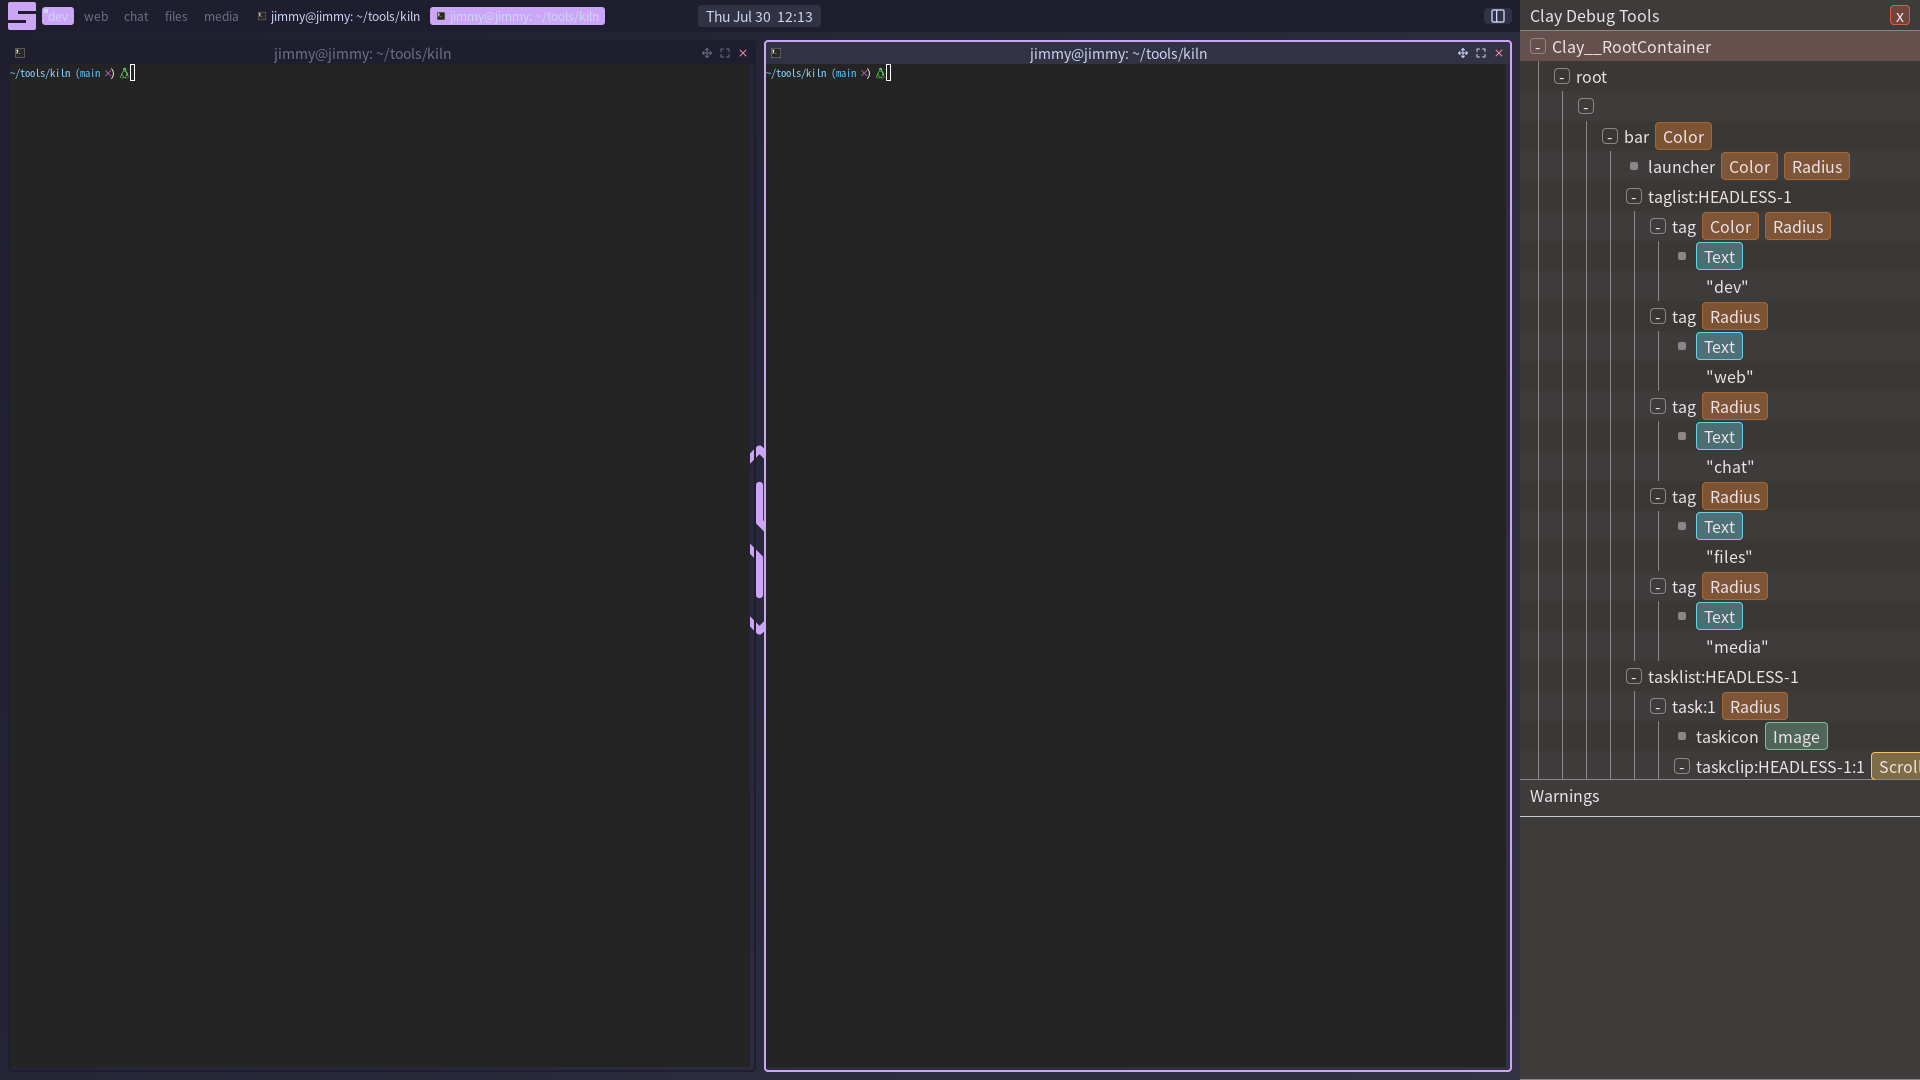
Open it
kiln's shipped config binds it to mod+shift+i. In your own config:
kiln.key {
	mods = { "mod", "shift" }, key = "i",
	desc = "toggle clay inspector", group = "system",
	press = function() kiln.inspector() end,
}
or over IPC, which is the one to reach for when a keybinding is the thing you are debugging:
scripts/kiln-eval 'require("kiln").inspector()'
kiln.inspector(s) takes an optional screen and defaults to the focused one. Close it with the same key or the x in its header.
Know what it does to your layout
The panel takes 400px off the right of the screen it is open on, and it does not cover the desktop: the root narrows and everything reflows into what is left, so bars and tiled clients move while it is open and return when you close it.
That is worth knowing before you use it to debug a layout, because the layout you are reading is being solved 400px narrower than usual. An element sized in percentages, or one that wraps, will not be showing you the numbers it has when the panel is shut.
What is in there
- The element tree of the last solve, one row per element, with a colour chip for each config an element carries and a quoted preview of any text.
- Hover a row and that element is highlighted in the real scene, so you can go from a row to the box it drew.
- Click a row for its full config in the bottom pane: bounding box, sizing modes with min and max, padding, gap, alignment, colours, corner radius, aspect, border, float, clip.
- Click the
[-]beside a row to collapse its subtree. - Wheel over either pane to scroll it. Clicks and wheels over the panel never reach your clients or your root bindings, so you cannot misfire a binding into the desktop while reading it.
- With nothing selected, the bottom pane lists Clay's own warnings for the frame instead.
Because the tree is the whole screen, so is the panel's contents: your bars, the selected tag's layout, every tiled client, floats, menus and notifications are all rows in it. There is no separate widget tree to inspect, because there is no separate widget tree.
Desktop screens only. The lockscreen solves into its own Clay context and cannot be inspected.
Name the elements you expect to debug
Some rows have no name. Those are elements declared without an id: ui.box, ui.row and ui.column do not require one, kiln does not invent one, and so there is no name to print. A blank row is still fully inspectable, its config reads normally in the detail pane, it just cannot be identified at a glance.
Giving an element an id is a pure annotation. It changes nothing about layout or behaviour:
ui.column({ id = "statusbar", h = 28, color = theme.bg }, function()
	ui.row({ id = "statusbar.left", gap = 8 }, function()
		-- ...
	end)
end)
Do it for anything you expect to come back to, for two reasons:
- The row is labelled in the tree, and that same name is what
core.hitsreports under a point and whatcore.box("statusbar")reads the solved box back by. - The identity holds still. An unnamed element is identified by its position among its siblings, so inserting a sibling ahead of it makes it a different element: its collapsed state resets, and a selection lands on a different row. Nothing warns you, and it happens exactly when the tree is most interesting, which is when a client maps or a widget appears conditionally.
Repeated elements need the table form, with a number as the second field:
for i, c in ipairs(t.clients) do
	ui.box({ id = { "task", i } }, function()
		-- ...
	end)
end
Two elements sharing an id in one frame is fatal in Clay, so a bare id = "task" inside a loop takes the session down. A non-numeric second field is caught earlier and reported as a config error with a stack trace.
Restyle it
Panel width and colours go through core.inspector, which also reads the current state back:
core.inspector("eDP-1", {
	width = 520,
	highlight = { r = 255, g = 200, b = 0, a = 80 },
	enabled = true,
})
Note the argument: kiln.inspector(s) takes a screen object, while core.inspector takes a screen name, like the rest of the core layer. Passing a screen object to core.inspector is an error.
Reading it back returns the state after the call, taken from Clay rather than a stored copy, because the panel can close itself from its own header button:
core.inspector("eDP-1")        --> true
core.inspector("eDP-1", false) --> false
Clay holds its debug style in process-wide globals, so the style keys apply to every screen regardless of the one named. See the core reference for the full set.