wibox.widget.graph
Keeps a list of values and draws one bar per value, newest at the right edge. Values come in through add_value; the graph scrolls as they arrive. Several data groups can be stacked.
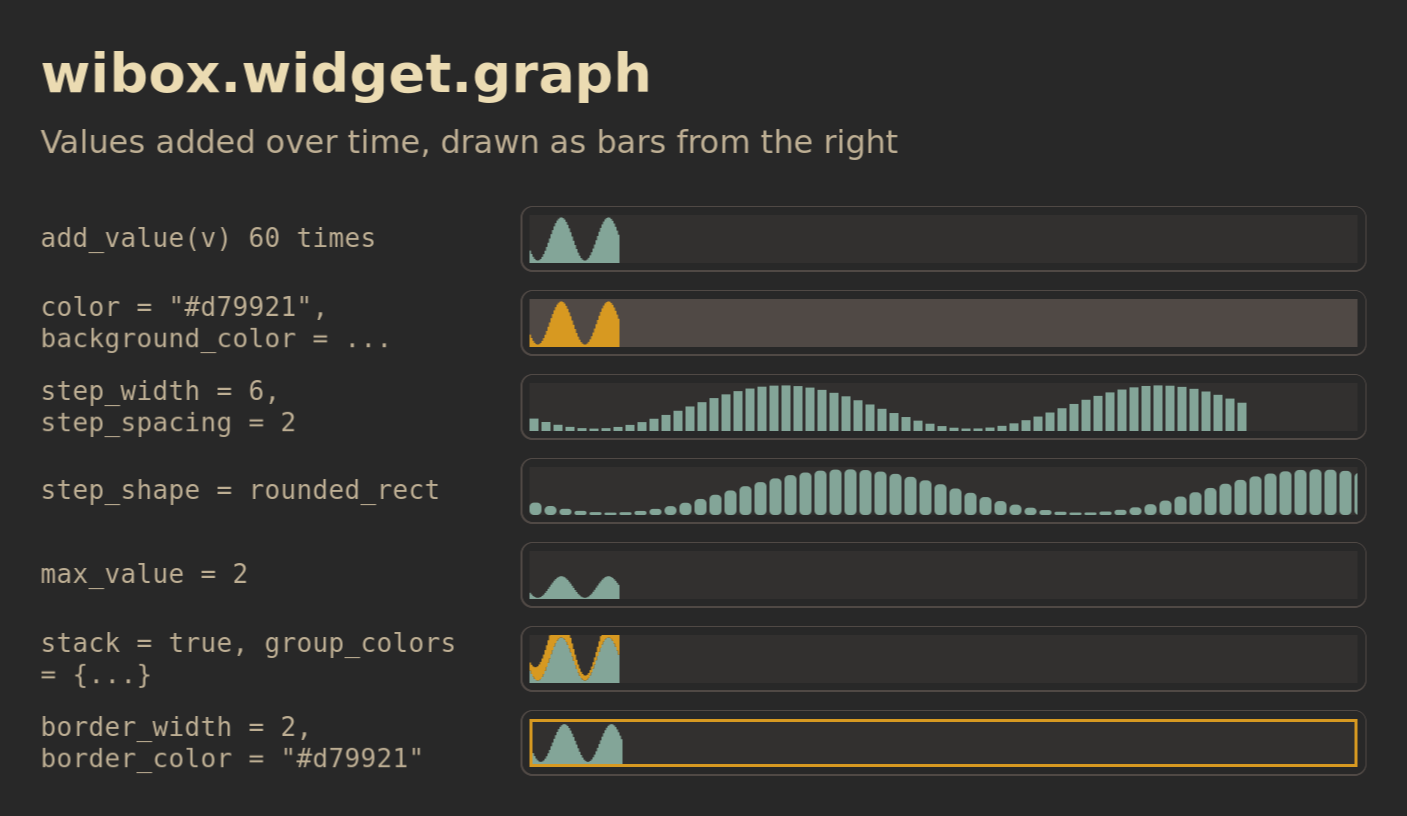
Each row sets one property. The outline is the box the widget was given.
Show Lua
Save this as /tmp/widget-graph.lua, then run:
somewm-client eval 'dofile("/tmp/widget-graph.lua")'
It opens the figure on your focused screen and closes after two minutes. Every row is a graph of the same 60 values with one property set.
-- Shared canvas for the SomeWM widget reference figures, in the style of the
-- 2.1.0 announcement diagrams: the session's theme colors and font family
-- with gruvbox fallbacks, a bold title and a muted subtitle, rounded cards
-- with one-pixel borders, 28 px margins, an ontop popup that closes itself.
--
-- generate.sh concatenates this file ahead of each scene and publishes the
-- result next to the PNG, so a reader can run the same file:
--   somewm-client eval 'dofile("/tmp/figure.lua")'
-- The scene calls F.scene(title, subtitle, rows). This file defines the
-- global F instead of returning a module because the concatenation is one
-- chunk with no package path.

local awful = require("awful")
local beautiful = require("beautiful")
local gears = require("gears")
local wibox = require("wibox")

if _G.somewm_reference_figure then _G.somewm_reference_figure.stop() end

F = {}

F.bg     = beautiful.bg_normal or "#282828"
F.fg     = beautiful.fg_normal or "#ebdbb2"
F.panel  = "#32302f"
F.slot   = "#504945"
F.muted  = "#bdae93"
F.amber  = "#d79921"
F.blue   = "#83a598"
F.green  = "#b8bb26"
F.family = (beautiful.font or "sans 10"):gsub("%s+%d+%.?%d*$", "")
F.font   = F.family .. " 14"
F.font_bold = F.family .. " Bold 14"
F.mono   = "monospace 13"

F.width       = 940
F.label_width = 300
F.slot_height = 44

function F.rounded(cr, w, h)
    gears.shape.rounded_rect(cr, w, h, 8)
end

-- A line of text in the figure's own font. size is in points.
function F.text(text, size, color, bold)
    return wibox.widget {
        markup = '<span foreground="' .. (color or F.fg) .. '">'
            .. gears.string.xml_escape(text) .. '</span>',
        font = F.family .. (bold and " Bold " or " ") .. size,
        widget = wibox.widget.textbox,
    }
end

-- A textbox in the figure font, for rows that show text. extra overrides
-- properties, which is how a row demonstrates one of them.
function F.label(text, extra)
    local t = { text = text, font = F.font, widget = wibox.widget.textbox }
    for k, v in pairs(extra or {}) do t[k] = v end
    return t
end

-- A solid block of a given size and color, for layout figures.
function F.block(w, h, color, text)
    return {
        text and {
            text = text, font = F.mono, halign = "center", valign = "center",
            widget = wibox.widget.textbox,
        } or nil,
        forced_width = w,
        forced_height = h,
        bg = color,
        fg = F.bg,
        shape = F.rounded,
        widget = wibox.container.background,
    }
end

-- One row: the property value in monospace, then the widget in a rounded
-- slot outlined in F.slot. The outline is the box the widget is given plus
-- opts.pad on each side (6 unless the scene needs the edge). opts.w and
-- opts.h size the slot; opts.fit lets it take the widget's own size.
function F.row(label, widget, opts)
    opts = opts or {}
    local slot = {
        { widget, margins = opts.pad or 6, widget = wibox.container.margin },
        border_width = 1,
        border_color = F.slot,
        shape = F.rounded,
        widget = wibox.container.background,
    }
    if not opts.fit then
        slot.forced_width = opts.w or (F.width - 56 - F.label_width - 20)
        slot.forced_height = opts.h or F.slot_height
    elseif opts.h then
        slot.forced_height = opts.h
    end
    return {
        {
            markup = '<span foreground="' .. F.muted .. '">' .. gears.string.xml_escape(label) .. '</span>',
            font = F.mono,
            ellipsize = "none",
            forced_width = F.label_width,
            widget = wibox.widget.textbox,
        },
        {
            slot,
            halign = "left",
            valign = "center",
            widget = wibox.container.place,
        },
        spacing = 20,
        layout = wibox.layout.fixed.horizontal,
    }
end

-- Build the figure as a centered popup on the primary screen, so every
-- capture comes from the same output and scale. It stays until
-- stop() runs or two minutes pass. Returns a message; generate.sh reads the
-- geometry from _G.somewm_reference_figure.popup once it has a size.
function F.scene(title, subtitle, rows)
    local target = screen.primary
    local contents = wibox.layout.fixed.vertical()
    contents.spacing = 12
    contents:add(F.text(title, 27, F.fg, true))
    contents:add(F.text(subtitle, 16, F.muted))
    contents:add(wibox.widget { forced_height = 6, widget = wibox.container.background })
    for _, r in ipairs(rows) do contents:add(wibox.widget(r)) end

    local popup = awful.popup {
        screen = target,
        visible = true,
        ontop = true,
        input_passthrough = true,
        bg = F.bg,
        fg = F.fg,
        minimum_width = F.width,
        maximum_width = F.width,
        placement = awful.placement.centered,
        widget = { contents, margins = 28, widget = wibox.container.margin },
    }
    local state = { popup = popup, screen = target }
    _G.somewm_reference_figure = state
    function state.stop()
        popup.visible = false
        if state.timer then state.timer:stop() end
        if _G.somewm_reference_figure == state then _G.somewm_reference_figure = nil end
    end
    state.timer = gears.timer.start_new(120, function() state.stop(); return false end)
    return title .. " figure opened on screen " .. target.index
end
-- wibox.widget.graph: the same values in a few styles.
local function graph(extra, groups)
    local t = { forced_width = 320, color = F.blue, background_color = F.panel, widget = wibox.widget.graph }
    for k, v in pairs(extra or {}) do t[k] = v end
    local w = wibox.widget(t)
    for i = 1, 60 do
        local v = 0.5 + 0.45 * math.sin(i / 5)
        if groups then w:add_value(v, 1); w:add_value(0.3 + 0.2 * math.cos(i / 7), 2) else w:add_value(v) end
    end
    return w
end
return F.scene("wibox.widget.graph", "Values added over time, drawn as bars from the right", {
    F.row('add_value(v) 60 times', graph()),
    F.row('color = "#d79921", background_color = ...', graph { color = F.amber, background_color = F.slot }),
    F.row('step_width = 6, step_spacing = 2', graph { step_width = 6, step_spacing = 2 }),
    F.row('step_shape = rounded_rect', graph { step_width = 8, step_spacing = 2, step_shape = function(cr, w, h) gears.shape.rounded_rect(cr, w, h, 3) end }),
    F.row('max_value = 2', graph { max_value = 2 }),
    F.row('stack = true, group_colors = {...}', graph({ stack = true, group_colors = { F.blue, F.amber } }, true)),
    F.row('border_width = 2, border_color = "#d79921"', graph { border_width = 2, border_color = F.amber }),
})
Download the Lua file. To close it early:
somewm-client eval 'if somewm_reference_figure then somewm_reference_figure.stop() end'
Constructor: wibox.widget.graph(args). Upstream page.
local cpu = wibox.widget {
    forced_width     = 100,
    color            = "#83a598",
    background_color = "#32302f",
    widget           = wibox.widget.graph,
}
cpu:add_value(0.42)
Properties
| Property | Type | Default | What it does | In SomeWM |
|---|---|---|---|---|
color | color | beautiful.graph_fg | Bar color. A gradient is drawn in the widget box. | A non-solid, non-gradient value warns once and is transparent. |
background_color | color | beautiful.graph_bg | Fill behind the bars. | Same rule. |
group_colors | table | { color } | One color per data group. | |
border_width | number | 0 | Outline thickness. | |
border_color | color | beautiful.graph_border_color | Outline color. | Must be solid or it warns once and is transparent. |
max_value | number | 1 | The value that reaches the top. | |
min_value | number | 0 | The value at the bottom. | |
scale | boolean | false | Grow max_value to the largest value seen. | |
clamp_bars | boolean | false | Keep bars for out-of-range values inside the box. | |
baseline_value | number | 0 | The value bars start from. | |
step_width | number | 1 | Width of one bar in pixels. | |
step_spacing | number | 0 | Gap between bars. | A negative value warns once and is 0. |
step_shape | function | gears.shape.rectangle | Shape of one bar. | |
stack | boolean | false | Draw the data groups on top of one another. | |
nan_indication | boolean | true | Mark NaN values. | |
nan_color | color | "#ffff00" | Color of the NaN mark. | Same rule as color. |
capacity | integer or nil | nil | How many values to keep. nil keeps as many as fit the width. |
Setting a property emits property::<name>.
Methods
| Method | What it does |
|---|---|
:add_value(value, group) | Appends a value to a data group (default 1). NaN is allowed. |
:clear() | Drops every value. |
:pick_data_group_color(index) | Returns the color used for a group. Override it to color groups by rule. |
:should_draw_data_group(index) | Returns whether a group is drawn. Override it to hide groups. |
:compute_drawn_values_num(width) | Returns how many values fit in width pixels. |
The common properties, methods and signals apply.